


Geophysics can aid in our understanding of what is taking place under the surface though correlation to other areas with similar geophysics that have been successful.
Pretivm and Seabridge Gold have used a very specific form of geophysics which has played a significant role in the discovery and development of their respective deposits. It’s called a Magnetotelluric (MT) survey.
“MT technology has proven to be an effective tool for conceptual modeling of deep targets at KSM and helped to guide the discovery of the Deep Kerr. The same method is being used to identify other potential core zones” – Rudi Fronk (CEO Seabridge Gold), 2014.
Since that statement was made, MT technology has been used to discover the “Mitchell at depth” and “Lower Iron Cap” zones and expand the “Deep Kerr” zone. This technology has proven its accuracy time and again, which is why it has been used so extensively by Pretivm and Seabridge over the years.
In 2016, Tudor Gold conducted the same MT survey on Treaty Creek using the same equipment with the same geophysicist that designed and interpreted the MT surveys on the adjoining properties. The results of that survey are remarkable as it confirms the geology in showing that the entire system is connected at depth. The leading authority on the Golden Triangle, and former regional geologist of the area, Dani Alldrick stated:
“Due to the extensive bedrock exposures (gossans and close to surface mineralization) of the Sulphurets porphyry system, we know that the diameter of the Sulphurets system is at least 25 km; this is a measured value documented across the mapped exposure of the intensely altered, pyritized paleosurface of the hydrothermal system which is well exposed through the area as an altered dacite pyroclastic unit, including extensive exposures on the Treaty Creek claimblock” - Alldrick, 1988.
Drilling on Treaty Creek has confirmed its geological relationship to other deposits within this world-scale hydrothermal system and the MT geophysical technology is doing the same showing the system connected at depth and potential for world-scale deposits on Treaty Creek.
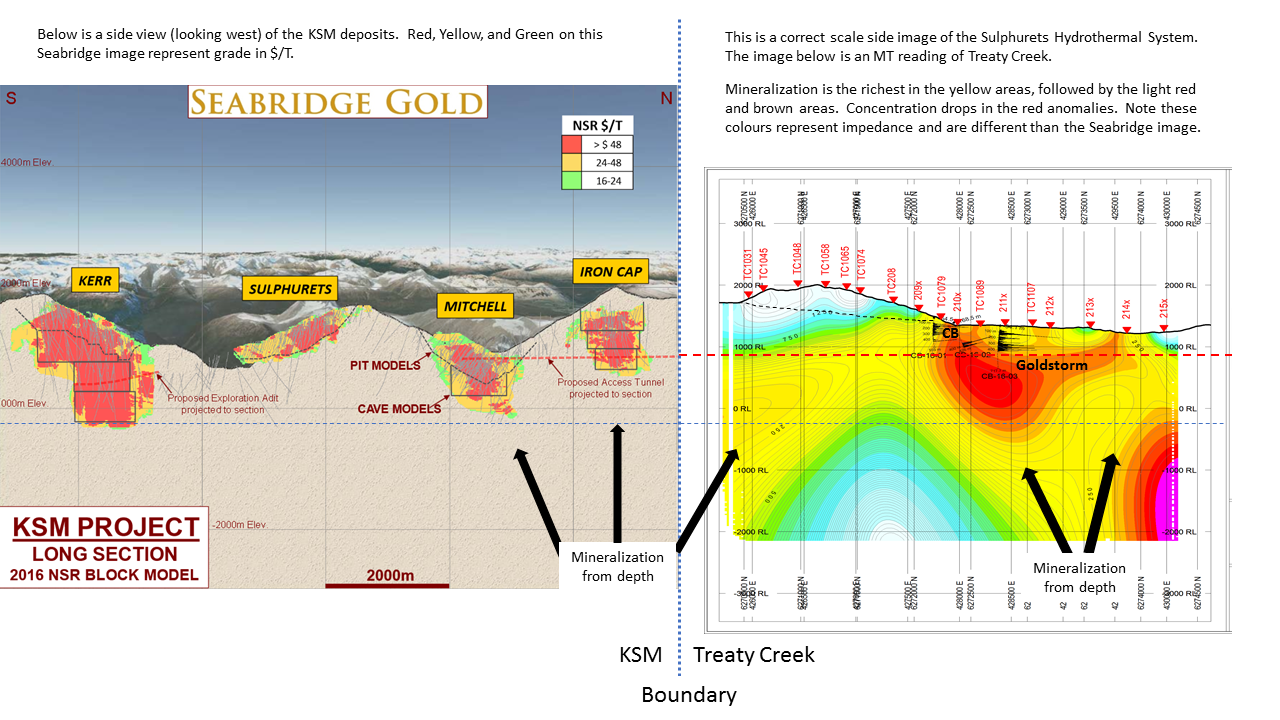
Below is a macro in-ground MT side image of Treaty Creek with the strongest signature of the mineralized rock being shown in yellow and then shades of brown. The red anomaly still carries mineralization but at a lower grade. You can see the yellow enriched feeder system coming up from below a 4km depth in two places. The yellow area shows the rock is the right impedance for hosting mineralization but doesn’t mean the entire area is mineralized.

The image above also shows the enriched 300 zone close to surface. It also shows the potential as the drills continues to move further north.
Below is an image of the Treaty MT anomaly on the right and the KSM deposits on the left. These are to scale and therefore give an indication of the potential mineralization on Treaty Creek (in yellow and light red / brown).
The image below has the KSM deposits on the left and Treaty Creek on the right. It shows drilling in the overlapping mag high (pink / red) and MT anomaly on Copper Belle (B) which produced the highest grades in that zone. There is a far larger mag anomaly overlapping a much bigger MT anomaly at the Konkin zone (A). This is to scale to give an idea of how big the anomalies are in comparison to the KSM deposits.
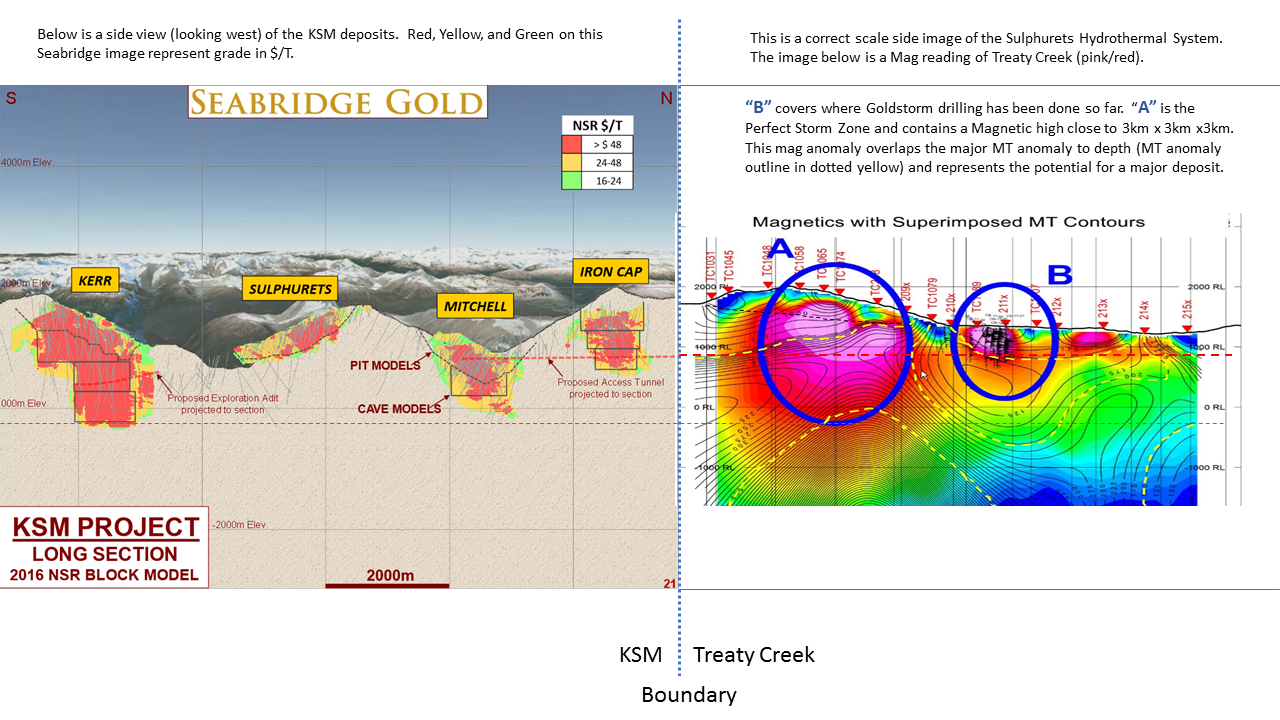
While all of the deposits in this “pearl necklace” are significant and have similarities, they are also unique. In some deposits a magnetic high overlapping a MT anomaly is a strong indicator of mineralization. This is why the first hole (CB16-03) was drilled into Goldstorm even though it’s not visible at surface. However, the magnetite intrusion at Goldstorm was after the primary mineralizing event and therefore the mag high doesn’t indicate the potential size of the deposit.
However, it is believed that the magnetite emplacement was part of the primary mineralizing event at Perfect Storm. If this is the case, then the magnetic pattern could indicate the potential size of the deposit.